7.4 EMP_summary
The module EMP_summary provides a quick overview of MAE and EMP objects. The visualization is divided into the following three sections:
Data dimension:
Samplerefers to the number of samples of experimental data in the current omics project, andFeaturerefers to the number of features in the current omics project.Data information:
Sample_attrrefers to the number of classifications of sample-related data in the current omics project, andFeature_atrrrefers to the number of classifications of feature-related data in the current omics project. For example, theFeature_atrris 8 in the experimenttaxonomy, which means that the feature annotation includes 8 levels of Kindom, Phylum, Class, Order, Family, Genus, Species, and Strain.Data miss:
Assay_status,Sample_status, andFeature_statusindicate whether there are missing values in the experimental data, sample-related data, and feature-related data of the current omics project, respectively.
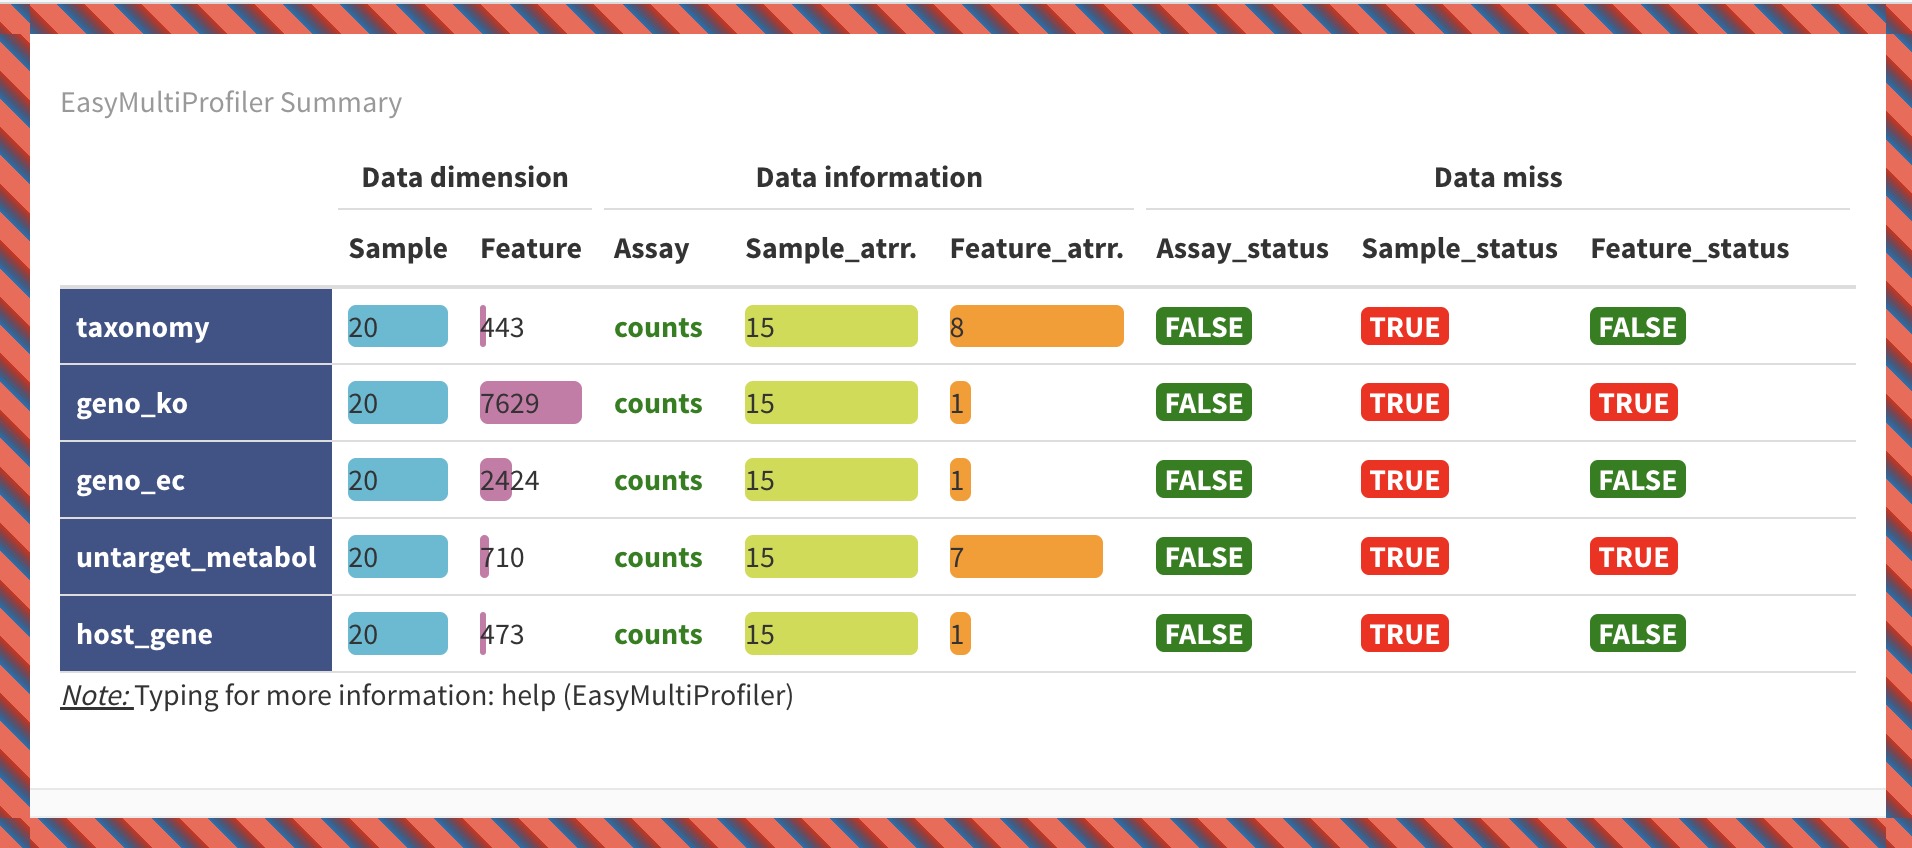
7.4.1 Visualization of MAE Object
data(MAE)
MAE |> EMP_summary()
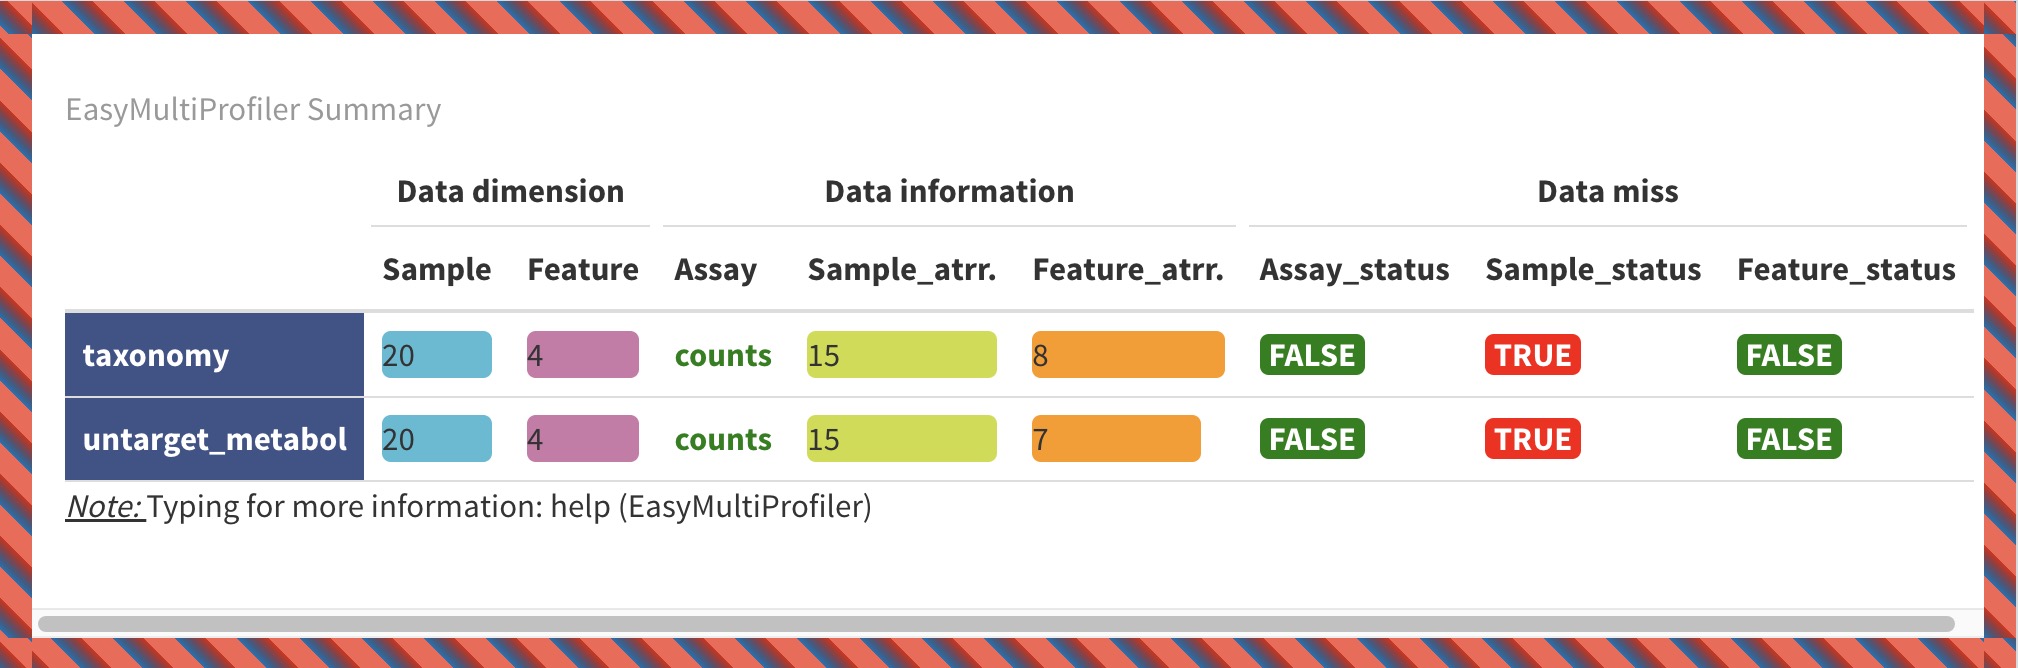
7.4.2 Overview Visualization of EMP Object
k1 <- MAE |>
  EMP_assay_extract('taxonomy') |>
  EMP_collapse(estimate_group = 'Genus',collapse_by = 'row') |>
  EMP_diff_analysis(method='DESeq2', .formula = ~Group) |>
  EMP_filter(feature_condition = pvalue<0.05)

k2 <- MAE |>
  EMP_collapse(experiment = 'untarget_metabol',na_string=c('NA','null','','-'),
               estimate_group = 'MS2kegg',method = 'sum',collapse_by = 'row') |>
  EMP_diff_analysis(method='DESeq2', .formula = ~Group) |>
  EMP_filter(feature_condition = pvalue<0.05 & abs(fold_change) > 1.5)

(k1 + k2) |> EMP_summary()